
Is Bell Curve really a Great Intellectual Fraud?
Bell Curve = Great Intellectual Fraud?
I recently read a New York Times best-seller titled “Black Swan” by Nicholas Taleb. The book discusses how hard it is to predict rare events like Black Monday and 911. He claims that for predicting these events, statistical modeling is of no use. I am generally for the idea that current statistical modeling cannot handle outliers like the aforementioned. However, there was one part of the book which I had trouble agreeing with. Here is the summary of that passage taken from wikipedia:
Almost everything in social life is produced by rare but consequential shocks and jumps; all the while almost everything studied about social life focuses on the ‘normal,’ particularly with ‘bell curve’ methods of inference that tell you close to nothing. Why? Because the bell curve ignores large deviations, cannot handle them, yet makes us confident that we have tamed uncertainty. Its nickname in this book is GIF, Great Intellectual Fraud. Black Swan Theory (wikipedia)
As a statistics student, I was offended to hear that Taleb claims that a ‘bell curve’ is the Great Intellectual Fraud, and that this book is convincing many business people to think that way. Just because the current statistical models failed to capture events like the financial crisis, this doesn’t mean the ‘bell curve’ is a fraud. In fact, ‘bell curve’ enhanced the human capabilities to understand the world so much. It is arguably the most concept you can learn in probability, with so many real world applications aside from the prediction of rare events.
Hence, I decided to write about the importance of ‘bell curve’. I hope to convince my readers why it is definitely not an intellectual fraud.
Bell curves as distributions.
To prepare you for the next sections, what Taleb refers to as the ‘bell curves’ is called ‘normal distributions’ or ‘Gaussian distributions’ by statisticians. I’ll occasionally use these terms to refer to the same concept. For the reasoning behind these namings, please refer this link.
Entropy as a measure of information encoded
Say you have a dataset in front of you, and you want to understand the data. Any attempts of trying to understand a dataset can be thought of as a “distribution”. There is always some underlying data generation process, and we hope to find a “distribution” that best models that process. Initially, you have no clue where to start, but you want to model the data somehow using a distribution, just to get started. In such a situation, we hope to find a distribution that makes the least assumption about the data.
Among what is a good de facto as a starter distribution to model the data? How can we find a distribution with the least amount of assumption about the data? It seems hard to find the single best one, but in theory, we can find such a distribution. In fact, that distribution is the bell curve.
To formalize the argument, let’s define what it means for distributions to capture the information of a dataset i.e. entropy. Entropy is defined on distributions (and hence on random variables) and encodes how much uncertainty there is to the distribution. It is defined as follows:
\[H(X) \equiv -\sum_{k=1}^K p(X=k) log_2p(X=k)\]Note that for simplicity, I’m assuming that the distribution takes only finitely many (K) values. The higher the entropy is, the less assumption distributions make about the underlying data generation process. To see why this is the case, consider a coin flip, where we don’t know what the probability of landing heads is.
Entropy for a Bernoulli random variable
First, let’s naively assume that it is a fair coin. Let \(X\) be the indicator that the coin landed heads under this assumption. As noted in the previous post,
\[X\sim Bern(\frac{1}{2})\]Hence,
\[\begin{align} H(X) &= -(p(X=0)log_2p(X=0)+p(X=1)log_2p(X=1))\\ &= -2\cdot \frac{1}{2}\cdot log_2 \frac{1}{2} \\ &= 1 \\ \end{align}\]Similarly, consider the other extreme assumption that the coin always lands heads. Let \(Y\) be the indicator that the coin lands heads. Now,
\[Y\sim Bern(1)\]Hence,
\[\begin{align} H(X) &= -(p(X=0)log_2p(X=0)+p(X=1)log_2p(X=1))\\ &= -1\cdot log_2 1 \\ &= 0 \\ \end{align}\]Consider the implications of these two distributions, when we model a coin flip as a fair coin flip, the entropy is high, meaning that we are make little assumptions about the coin flip. On the other hand, in the case of a always-heads coin flip, the entropy is low, meanign that we are making a lot of assumptions about the coin flip. This should make an intuitive sense; no one, when seeing the coin for the first time would make an assumption that coin would always land heads! For different values of \(p\), the probability of the coin landing heads, the entropy is as follows:
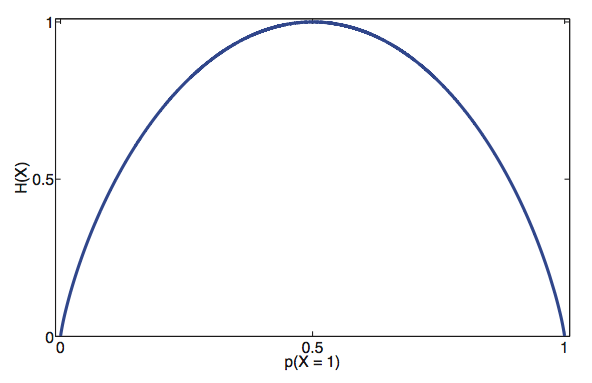
Hence, when given a coin, and we want to make the least amount of assumptions about \(p\), \(X\sim Bern(\frac{1}{2})\) is the initial distribution we should assume as it provides the highest entropy.
‘Bell curves’ maximize entropy.
In the example of a coin flip, the outcome was binary. What is the outcome was continuous and takes the values from \(-\infty\) to \(\infty\)? What is the distribution that maximizes the entropy?
The continuous version of the max entropy is:
\[H(X) \equiv -\int_{x} p(x) log_2p(x) dx\]where \(p(x)\) is the PDF of \(X\).
We would like to maximize this with respect to the constraint that the PDF integrates to 1:
\[\int_{-\infty}^{\infty} p(x) dx = 1\]This is a simple optimization problem which can be solved using a Lagrange multiplier. The objective is to maximize:
\[-\int_{-\infty}^{\infty} p(x) log_2p(x) dx + \lambda_0(\int_{-\infty}^{\infty} p(x) dx - 1)\]We actually need two more assumptions here: the mean and the variance of the distribution is known. In other words, we are going to consider a situation where we know nothing about the data BUT the mean and the variance. Let them be \(\mu\) and \(\sigma^2\). From the definition of mean and variance,
\[\int_{-\infty}^{\infty} xp(x) dx = \mu\] \[\int_{-\infty}^{\infty} x^2p(x) dx = \sigma^2\]Adding this as constraints to the optimization problem, the final objective to maximize becomes:
\[\begin{align} & -\int_{-\infty}^{\infty} p(x) log_2p(x) dx \\ & +\lambda_0(\int_{-\infty}^{\infty} p(x) dx - 1) \\ & +\lambda_1(\int_{-\infty}^{\infty} xp(x) dx - \mu) \\ & +\lambda_2(\int_{-\infty}^{\infty} x^2p(x) dx - \sigma^2) \end{align}\]Solving this yields,
\[p(x) = \frac{1}{\sqrt{2\pi \sigma^2}} e^{\frac{x^2}{2\sigma^2}}\]which is exactly the PDF of a normal distribution!
Hence, we have that given the mean and the variance of the data, normal distribution is the distribution that makes the least amount of information about the data.
Normal is not GIF!
What does this derivation of the normal distribution tells us about Taleb’s claim about the ‘bell curve’? It says that his claim doesn’t make sense! First of all, as we have seen, anywhere in statistics or information theory claim that normal distribution is what we should use all the time to model the data. It only says that when there is no information (but the mean and the variance) about the data given, normal distribution makes as little assumptions as possible.
Obviously, the fact that normal distribution makes the least assumption doesn’t mean that we shouldn’t use the distribution. It is always a good starting point when confronted a dataset, since it avoids any bias we may have about the distribution of the data.
In the following posts, I would also like to introduce other important concepts involving the normal distribution, such as the central limit theorem, Kalman Filters and Gaussian Processes.
Leave a Comment